week-to-week stability of proposed 2012 Low-Key scoring formula
In two previous posts, I described an attempt to revise the scoring code for the Low-Key Hillclimbs. The scoring has placed a priority on simplicity. At first, we normalized times to the fastest man and woman each week. But then everyone's score was exceptionally sensitive to the fastest rider. Then I switched to using the median time for normalization, first separately for men and women, then using combing them with an empirically determined conversion factor for women. But while median is less sensitive to any single individual showing up, nevertheless the most challenging climbs tend to attract fewer beginner riders, deflating the scores for these weeks. So the alternative approach is to iteratively rate each climb using a reference time based on the rating of riders who show up, and assign each rider a rating based on the reference times (and their results) of the climbs they do.
A concern about this approach is that if I use all available information equally, I re-rate each rider and each climb after each week's results. This yields scores for previous weeks changing each time results for a new week become available. This is in principle an undesirable feature. It could be avoided by forcibly freezing ratings for climbs each week, rating only new climbs using results including those which preceed it. You might call this approach causal scoring (nothing is affected by future events). However, before taking such a compromize, I wanted to test whether pragmatically this is a problem. Obviously if relative scores from previous weeks are highly volatile then it makes tactical decisions difficult. For example, your previous scores might all be better than the scores of another rider, then you mark him and out-sprint him in this week's climb, but afterwards you've fallen behind in the standings because of a re-evaluation of the reference times for previous weeks. This is something of a pathological example, but it's in principle possible, so it needs to be tested using realistic data.
So I ran the scoring code for 2011 data, which exist for seven weeks of climbs. Two climbs, Kings Mountain Road and Mount Hamilton Road, have not yet occurred.
After week 1, Mountebello Road, there is only one climb on which to determine a reference time, so I revert back to using the median time. I could also use the geometric mean, which would be closer to what I do when there's multiple times, but the median works well so I stick with that. The climb's field is then by definition average. There is no adjustment for the strength of the field.
Then I add data from week 2, Sierra Road. Now we see that some riders did both weeks. On one or the other week, using median times, these riders would score lower (it turns out they generally would score lower on Sierra Road). I then assume that on the week they score lower the average rider was stronger, and adjust the climb reference time so riders who did both, on average, score the same (using geometric means). Then each week other riders are scored relative to these repeat riders. This causes a re-evaluation of the reference time for the first week: it's no longer the median time.
Now I add week 3, and I can use all data from riders who did at least two of the climbs to rate the fields of riders relative to each other. These riders are used to re-establish reference times for the first two weeks.
And the process continues until I have added data from all seven weeks.
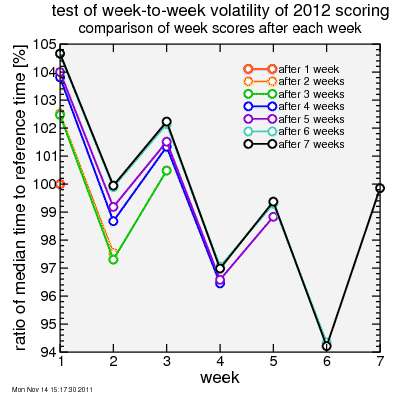
Here's the test results. First I plot the ratio of each week's median time to its reference time. So if this number is more than 100%, that means that the reference time will be less than the median time, and riders will score lower than with the 2011 algorithm. This adjustment is because, according to the algorithm, on average there were more slower riders and fewer faster riders on that climb. The plot shows this ratio for each climb plotted at the end of each week. After one week, there is only one point: for week 1, Montebello, and of course since that climb uses the median time it is at 100%. After two weeks there are two points: one for Montebello and one for Sierra Road. That curve is orange. Here Montebello is around 102.5% and Sierra Road is around 97.5%, so there were stronger riders at Sierra Road. Week 3 was Page Mill and that came out between the first two climbs. You can see how each week the reference time for each climb is adjusted, generally upward since as the series has continued later climbs have attracted on average stronger riders, it seems. So each week scores from Montebello, week 1, would tend to drop a bit as the algorithm assigns relatively higher scores to riders with a similar relative placing at later climbs.
This seems like it might be a problem, having things change over time. And this is true for someone who has a particular score goal, like 100 points. They may have 100.1 points after Montebello only to find that has dropped to 95.1 points later in the series. But for the standings, all that matters is how points from one climb compare to points of another. For example, if after two weeks rider A, who climbed only Montebello, scored 101 points there while rider B, who climbed only Sierra Road, scored 100 points there than rider A is ahead of rider B. After week 3 perhaps rider A's score for week 1 drops to 99 points and rider B's score drops to 98 points, but that's okay as long as the gap between the two doesn't change much.
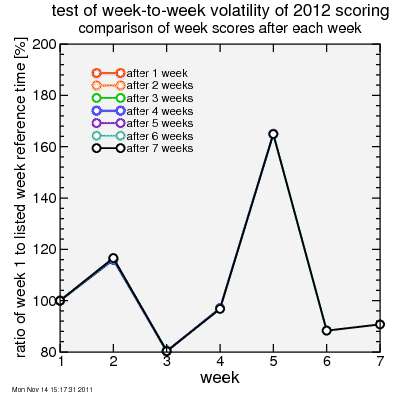
So next I plot the ratio of a climb's reference time to the reference time for Montebello. If the two change by the same proportion this ratio doesn't change, and a comparison of riders between the two climbs won't change much. As hoped, this ratio doesn't change much as new results are added to the analysis.
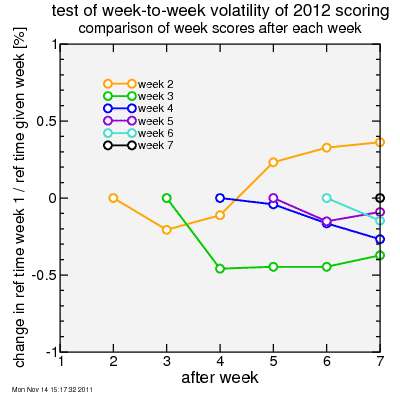
The resolution of that plot is limited, so in the next plot I how much each of these ratios changes after each week of results is added. Using the example before of riders A and B, for rider A to keep his 1-point gap over rider B, we want this ratio to be stable to around 1%. From the plot you can see that none of the comparisons between any of the weeks and week 1 changes by more than 0.5%. The biggest change is between week 2 and week 3, but still these change relative to each other by barely over 1%. So scores shifting relative to each other over the course of the series doesn't seem to be a big problem. So the scoring system seems to work pretty well, at least if you don't mind scores drifting a bit together.


Comments